Giving Clients Street-Level Insight with InfoSparks
October 30, 2020 MLS Updates ShowingTime Staff

Home buyers usually have a general idea of where they want to buy their home, relying on your knowledge of the market to narrow their sights on specific areas. However, some buyers know exactly what neighborhoods they are interested in, sometimes even down to the street.
Your clients may want to move into the neighborhood where their best friends or family members live, or one with a pool, close to a grocery store, train station, etc. With InfoSparks’ mapping interface tool and unique filtering options, you can easily collect and compare customized home statistics in up to four of their specific areas of interest. These statistics will ultimately help your clients find the best house to fit their needs.
Simply follow the directions below to get started.
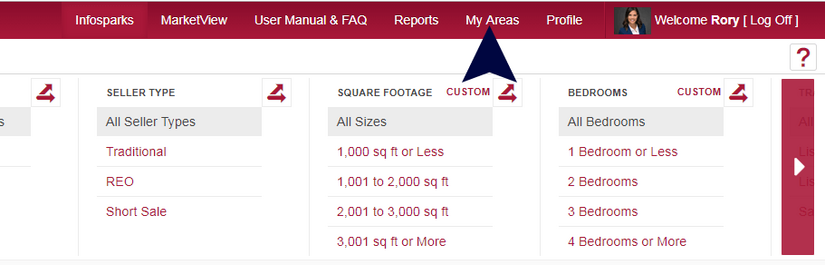
1. Once logged in to InfoSparks, click on the “My Areas” tab in the main menu at the top of your screen. (This report is not available in all markets.)
2. This will take you to the mapping interface tool, where you can draw a shape to select a specific area of the map that represents your client’s first area of interest.
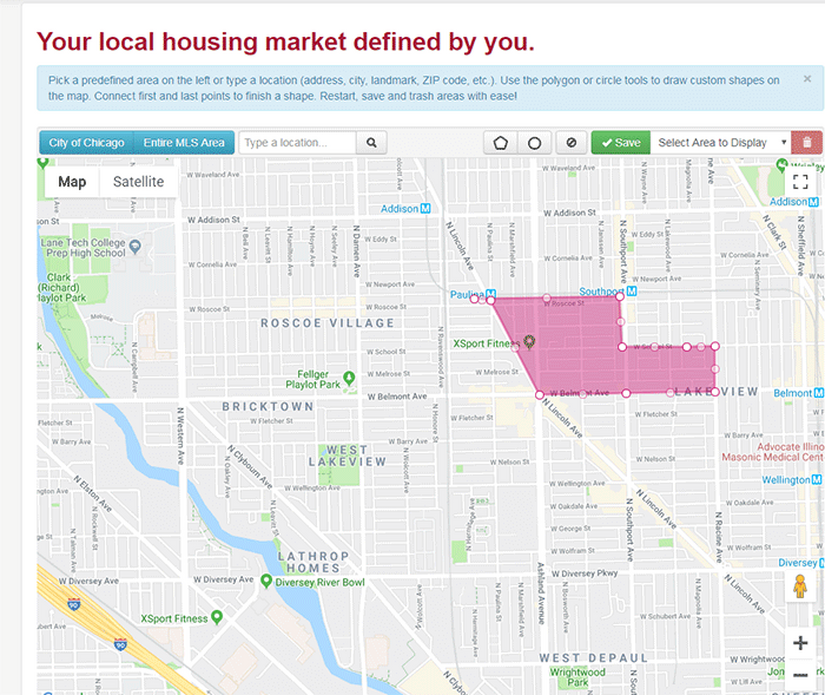
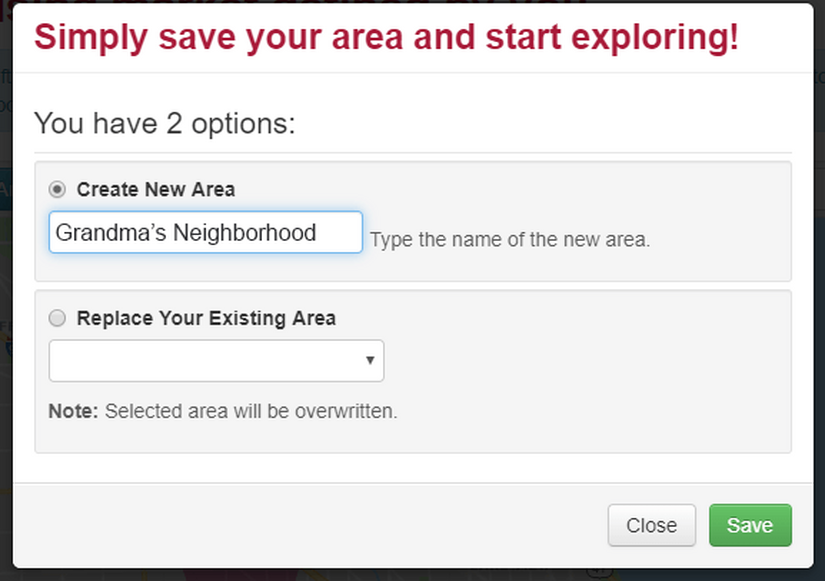
3. Once highlighted, click the “Save” button. A box will pop up with your options and you can name the area accordingly.
4. Return to the map and clear your current shape to begin defining a new area.
Draw a shape around the client’s second area of interest and click “Save.”
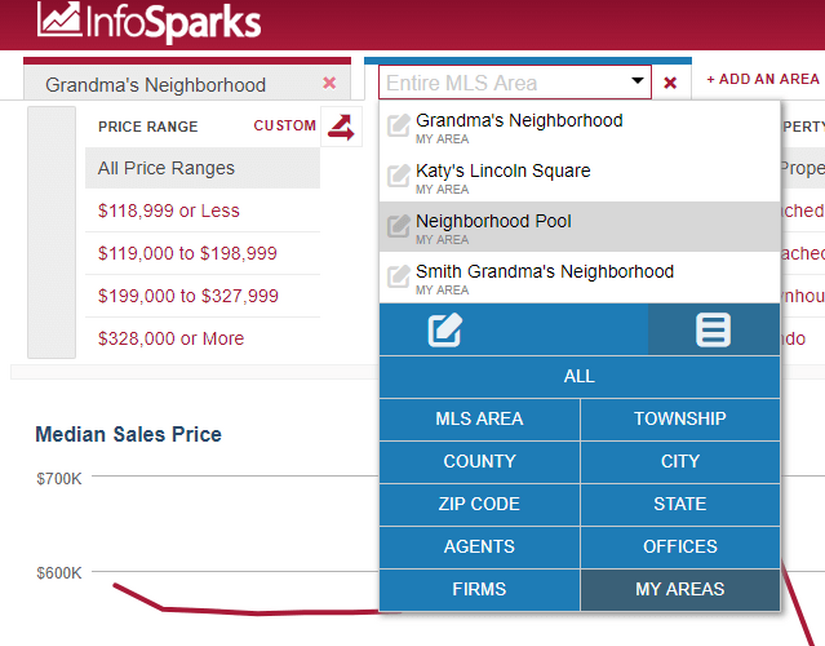
After both shapes have been drawn and saved, return to the InfoSparks homepage where you will set up a report to compare the two areas. Click on the drop-down box in the upper left-hand corner of the screen and choose “My Areas.” Then select your first saved area.
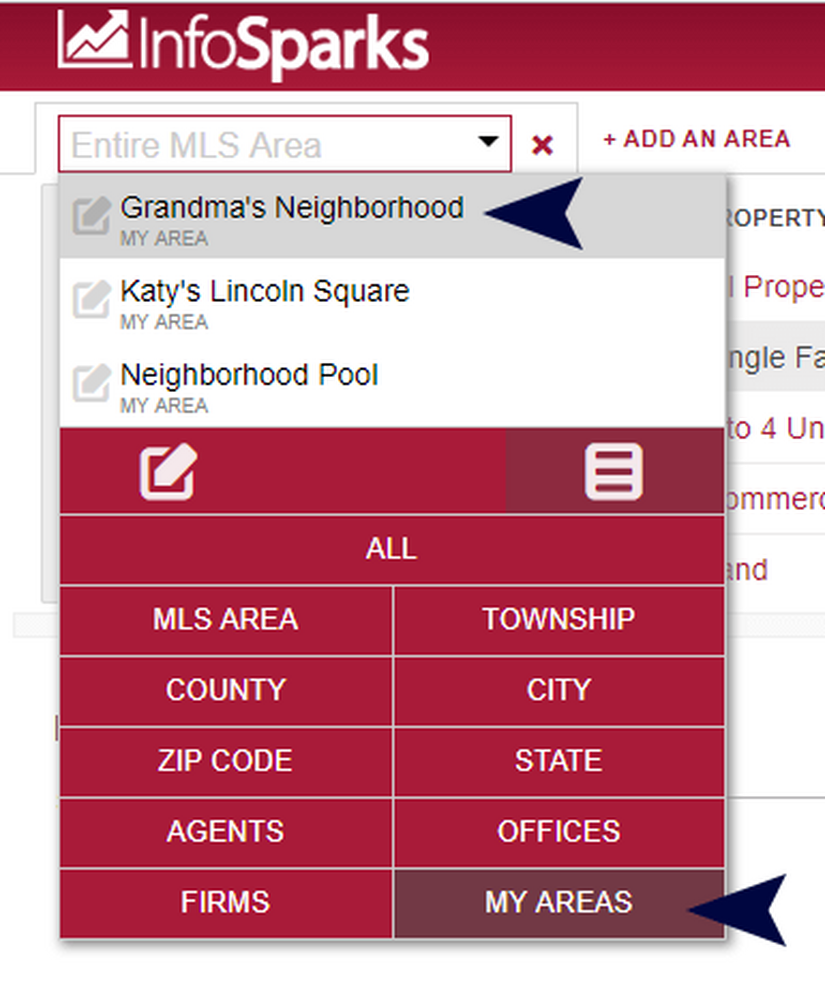
5. Click “Add an Area” and then select your second saved area from the drop-down menu.
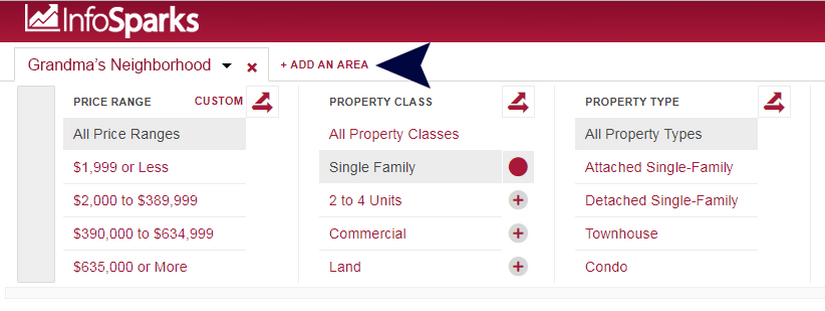
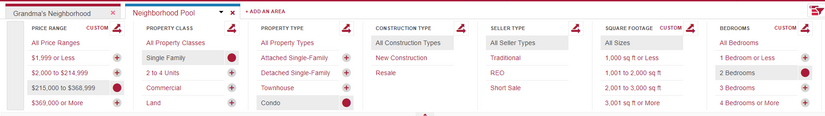
6. Select the categories that are important to your clients for your comparison such as price and number of bedrooms*.
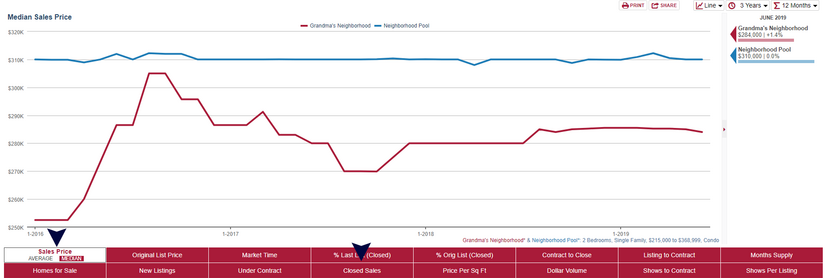
7. Then, choose the type of data you want to compare.
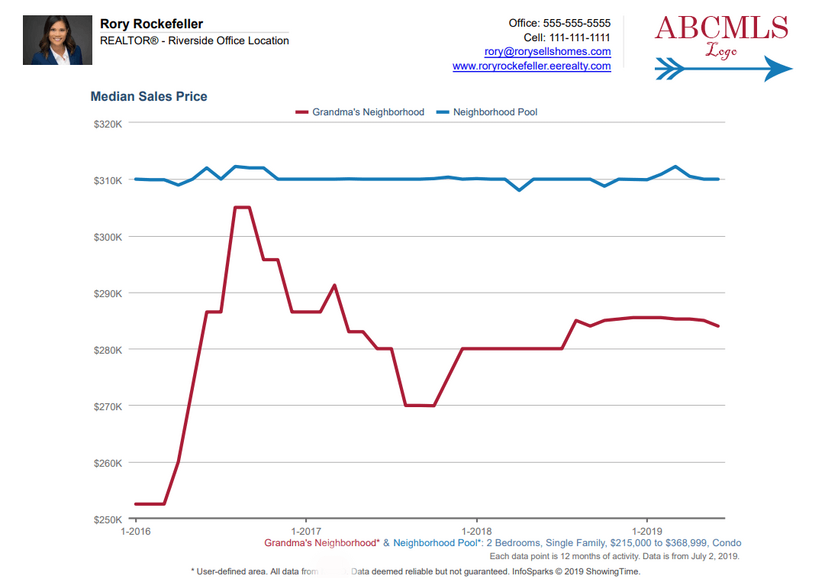
In this case, “Sales Price” or “Closed Sales” would be good options, as you want to see how many homes with your clients’ specifics are available and/or selling in each area.
The personally branded chart is available to print or share. Simply click “Print” or “Share” to see your options on how to show your data to your clients. They will be impressed with the customized, specific information you gathered for them!
*Please check to see what variables are available in your market