June Cape Cod Market Report
July 18, 2022 Research & Data, MarketStats CCIAOR Data and Research
*Information provided in this video is pulled on the 5th day of the following month, so numbers may not be an exact match to the information below. Median List Price is calculated using all properties that were active for sale with a list date prior to June 1st, 2022
1.) Month's Supply of Inventory Explains a Lot in This Market
There feels like there is more inventory on the market, but the reality is that there is not. When comparing inventory numbers to last June, the overall numbers were down, and the number of new listings are still down. So, why does there feel like there are more listings? It feels this way because Months Supply of Inventory is up.
What does Months Supply of Inventory Mean?
Months supply of inventory is a metric that measures how long it would take to sell all of the inventory on the market. It measures not only inventory, but also measures the rate at which properties are going under agreement; essentially the demand that is in the market.
Months supply of inventory is up from last June despite inventory being down, which is a way to quantify lessening demand in the marketplace.
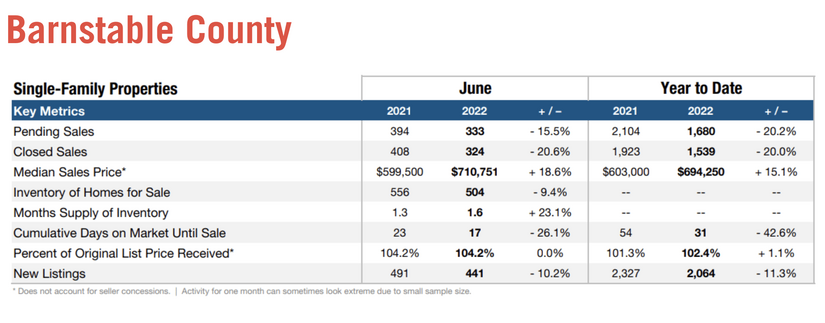
In June, the months supply of inventory for Barnstable County was 1.6 months. During the low inventory, high demand months, we were at 8/10ths of a month or so - meaning there was about three week’s supply of inventory on the market. Today’s number is double that. This is still far off from there being a balanced market.
What is a ‘balanced market’?
Most real estate economists say a balanced housing market is when there is 6 to 9 months of inventory on the market because that is the time it takes to build a home to add supply. In our market, it can take significantly longer than six to nine months to build a home to add to supply since there is very little new home production in Barnstable County.
2.) Housing Affordability Index Reaches an All-Time Low
What is the Housing Affordability Index?
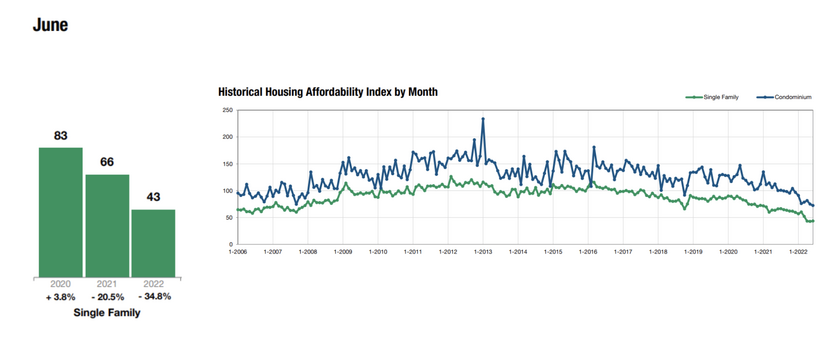
This index measures housing affordability for the region by using median sales price, median income, and prevailing interest rates. For example, an index of 120 means the median household income is 120% of what is necessary to qualify for the median-priced home under prevailing interest rates. A higher number means greater affordability.
What is Barnstable County’s Affordability Index?
Barnstable County’s Housing Affordability Index has been steadily dropping as the median sales price has risen; however, in June it reached an all-time low. This finally passed the prior low, which was reached in 2006.
The current Barnstable County Housing Affordability Index is 43 - meaning that the area median household income is only 43% of what is necessary to afford a median-priced home.
Why is the index getting worse now?
A rising median sale price coupled to higher interest rates is creating an even greater loss of affordability for buyers.
Read the Full Market Report
According to preliminary data released last week by the Cape Cod & Islands Association of REALTORS® (CCIAOR), 410 homes were sold in June,324 single-family homes, and 86 condominiums. The median sales price was $710,751 for single-family homes and $427,000 for condominiums. Last June, 520 homes (408 single-family homes and 112 condos) sold at a median price of $599,500 for single-family homes and $394,500 for condominiums.
Sales pending at the end of June were 333 for single-family homes and 86 for condominiums – a 15.5 percent decrease for single-family and a 10.4 percent decrease for condominiums, which will show up in closed home sales in the coming months. Last June, there were 394 pending single-family homes and 96 pending condominiums.
At the end of June, there were 504 single-family homes for sale and 112 condominiums for sale in the Cape Cod & Islands Multiple Listing Service. Last June, there were 556 single-family homes and 148 condos listed for sale, a 9.4 percent decrease, and a 24.3 percent decrease, respectively.
Cumulative days on market for June decreased 26.1 percent for single-family homes compared to last June, dropping from 23 days to 17 days. Condominiums had a 25 percent increase in cumulative days on market compared to last June, increasing from 28 days to 35 days.
Data released reflects all single-family homes and condominiums in the Cape Cod & Islands Multiple Listing Service for Barnstable County.